
AI Product · 2025-2026
ClipsInsight
Turning video analytics into actionable creative decisions.
An AI-powered TikTok analytics experience designed to help creators understand performance, learn from stronger content, and make more informed creative decisions.
Overview
ClipsInsight is an AI-powered content optimization platform for TikTok creators.
I primarily worked on Engagement Analyzer, a core feature that helps creators understand video performance, identify stronger and weaker content, and uncover factors that may influence engagement so they can make more informed creative decisions.
This was a real client project that lasted approximately five months. As the primary designer for the feature, I led the experience from product structure and user flows to interaction and interface design, while continuously iterating based on user and stakeholder feedback.
I also contributed to AI-assisted prototyping and front-end implementation, allowing design ideas to move more quickly into testing and the product environment.
See the experience before the process
Single and Bulk Analysis support different ways of understanding content performance.
Single Analysis
Bulk Analysis
The Challenge
The problem wasn't just the UI. It was the lack of a clear decision-making experience.
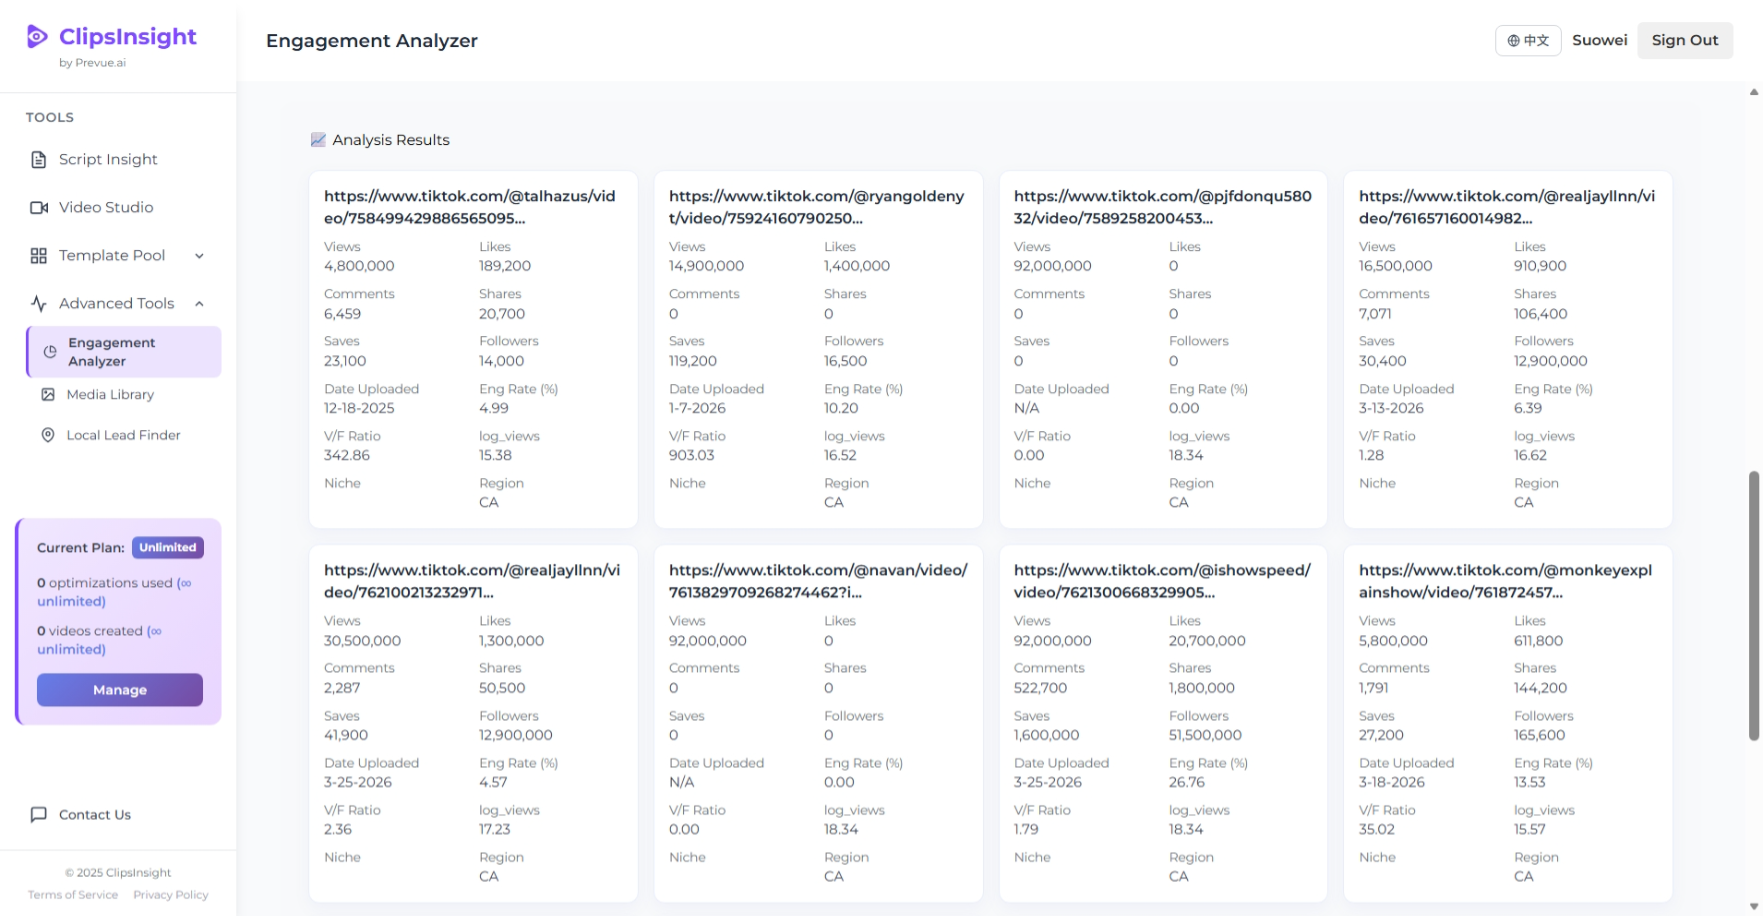
The original Engagement Analyzer behaved more like a technical output page than a mature product experience.
Although the interface surfaced a large amount of performance data, it lacked a clear information hierarchy. The experience made it difficult to quickly answer:
- Which metrics mattered most?
- What should they look at first?
- What did the numbers actually mean?
- Was the content performing well or poorly?
- What should they do after reviewing the results?
This revealed three core problems.
Information without hierarchy
Important and secondary metrics were presented with similar visual weight, making it harder for users to quickly identify what mattered.
Data without decision support
The interface showed users what happened, but provided limited context, explanation, or guidance to help them understand the results and make their next decision.
A structure that was difficult to scale
The existing structure felt disconnected from the broader ClipsInsight experience and was difficult to extend as the product introduced more comparison, analysis, and recommendation features.
Research Approach
Before redesigning the interface, I focused on understanding how creators interpreted video performance and what questions remained unanswered after reviewing the existing analysis.
The research process included:
Product Audit
I reviewed the existing Engagement Analyzer to understand its information architecture, metric hierarchy, and overall workflow.
User Feedback & Interviews
I explored how creators evaluated video performance, which metrics they relied on, and what they still wanted to understand after seeing the analysis.
Stakeholder Feedback
I worked with the team to understand product priorities, future feature needs, and technical considerations that could affect the design.
Iterative Review
I refined the information structure and interactions through multiple rounds of user and stakeholder feedback.
Key Insights
These findings shifted the project from simply asking, “How should we redesign this analytics dashboard?” to three more meaningful product questions.
Metrics need context to become meaningful.
Creators could already see metrics such as Engagement Rate, Views, and V/F, but isolated numbers provided little context for judging performance.
An Engagement Rate still left a basic question unanswered: Is this good?
The problem was not missing data, but missing reference points that could make the data meaningful.
Users knew what the number was, but not whether it was good.
Benchmark · Group Average · Performance Context
Recommendations are more useful when grounded in comparable content.
Creators wanted more than an explanation of whether a video performed well or poorly. They wanted concrete examples that could help them understand how their content differed from stronger, comparable videos.
Relevant high-performing references could help creators see which differences were worth exploring and what they might test in their next video.
Users needed a relevant high-performing reference, not just an abstract recommendation.
Comparable Reference → Difference → Next Experiment
Single and Bulk support different decision-making needs.
Although Single and Bulk Analysis use similar performance data, users approach them with fundamentally different goals.
Single Analysis focuses on one specific video, while Bulk Analysis focuses on relationships across multiple videos.
Single Analysis
One videoWhat stands out about this video’s performance?
- Understand one video's performance
- Identify weaker performance signals
- Interpret possible contributing factors
- Find targeted opportunities for improvement
Bulk Analysis
Multiple videosWhat patterns exist across my content?
- Compare multiple videos
- Identify stronger and weaker content
- Discover broader performance patterns
- Recognize approaches worth repeating
Single and Bulk should not be treated as the same analysis experience at different scales. Each requires its own information hierarchy and workflow based on a different user goal.
Single: Focused Analysis · Interpretation · Opportunities / Bulk: Comparison · Ranking · Pattern Discovery
From Research to Design
These three insights shifted the Engagement Analyzer from simply displaying data toward helping creators move through a more complete decision-making process.
Give performance metrics meaningful contextUse benchmarks, comparisons, and distribution views to help creators interpret performance rather than simply displaying isolated metrics.
Learn from comparable high-performing contentUse similar high-performing videos as references, helping creators understand key differences and identify what to test next.
Design Single and Bulk around different user goalsStructure Single around understanding one video in depth, while structuring Bulk around comparison, pattern discovery, and identifying approaches worth repeating.
Design Decisions
Designing around different analysis goals
Single and Bulk use similar performance data, but creators approach them with different questions. I designed each mode around the decisions users needed to make in that context.
Understand one video in depth
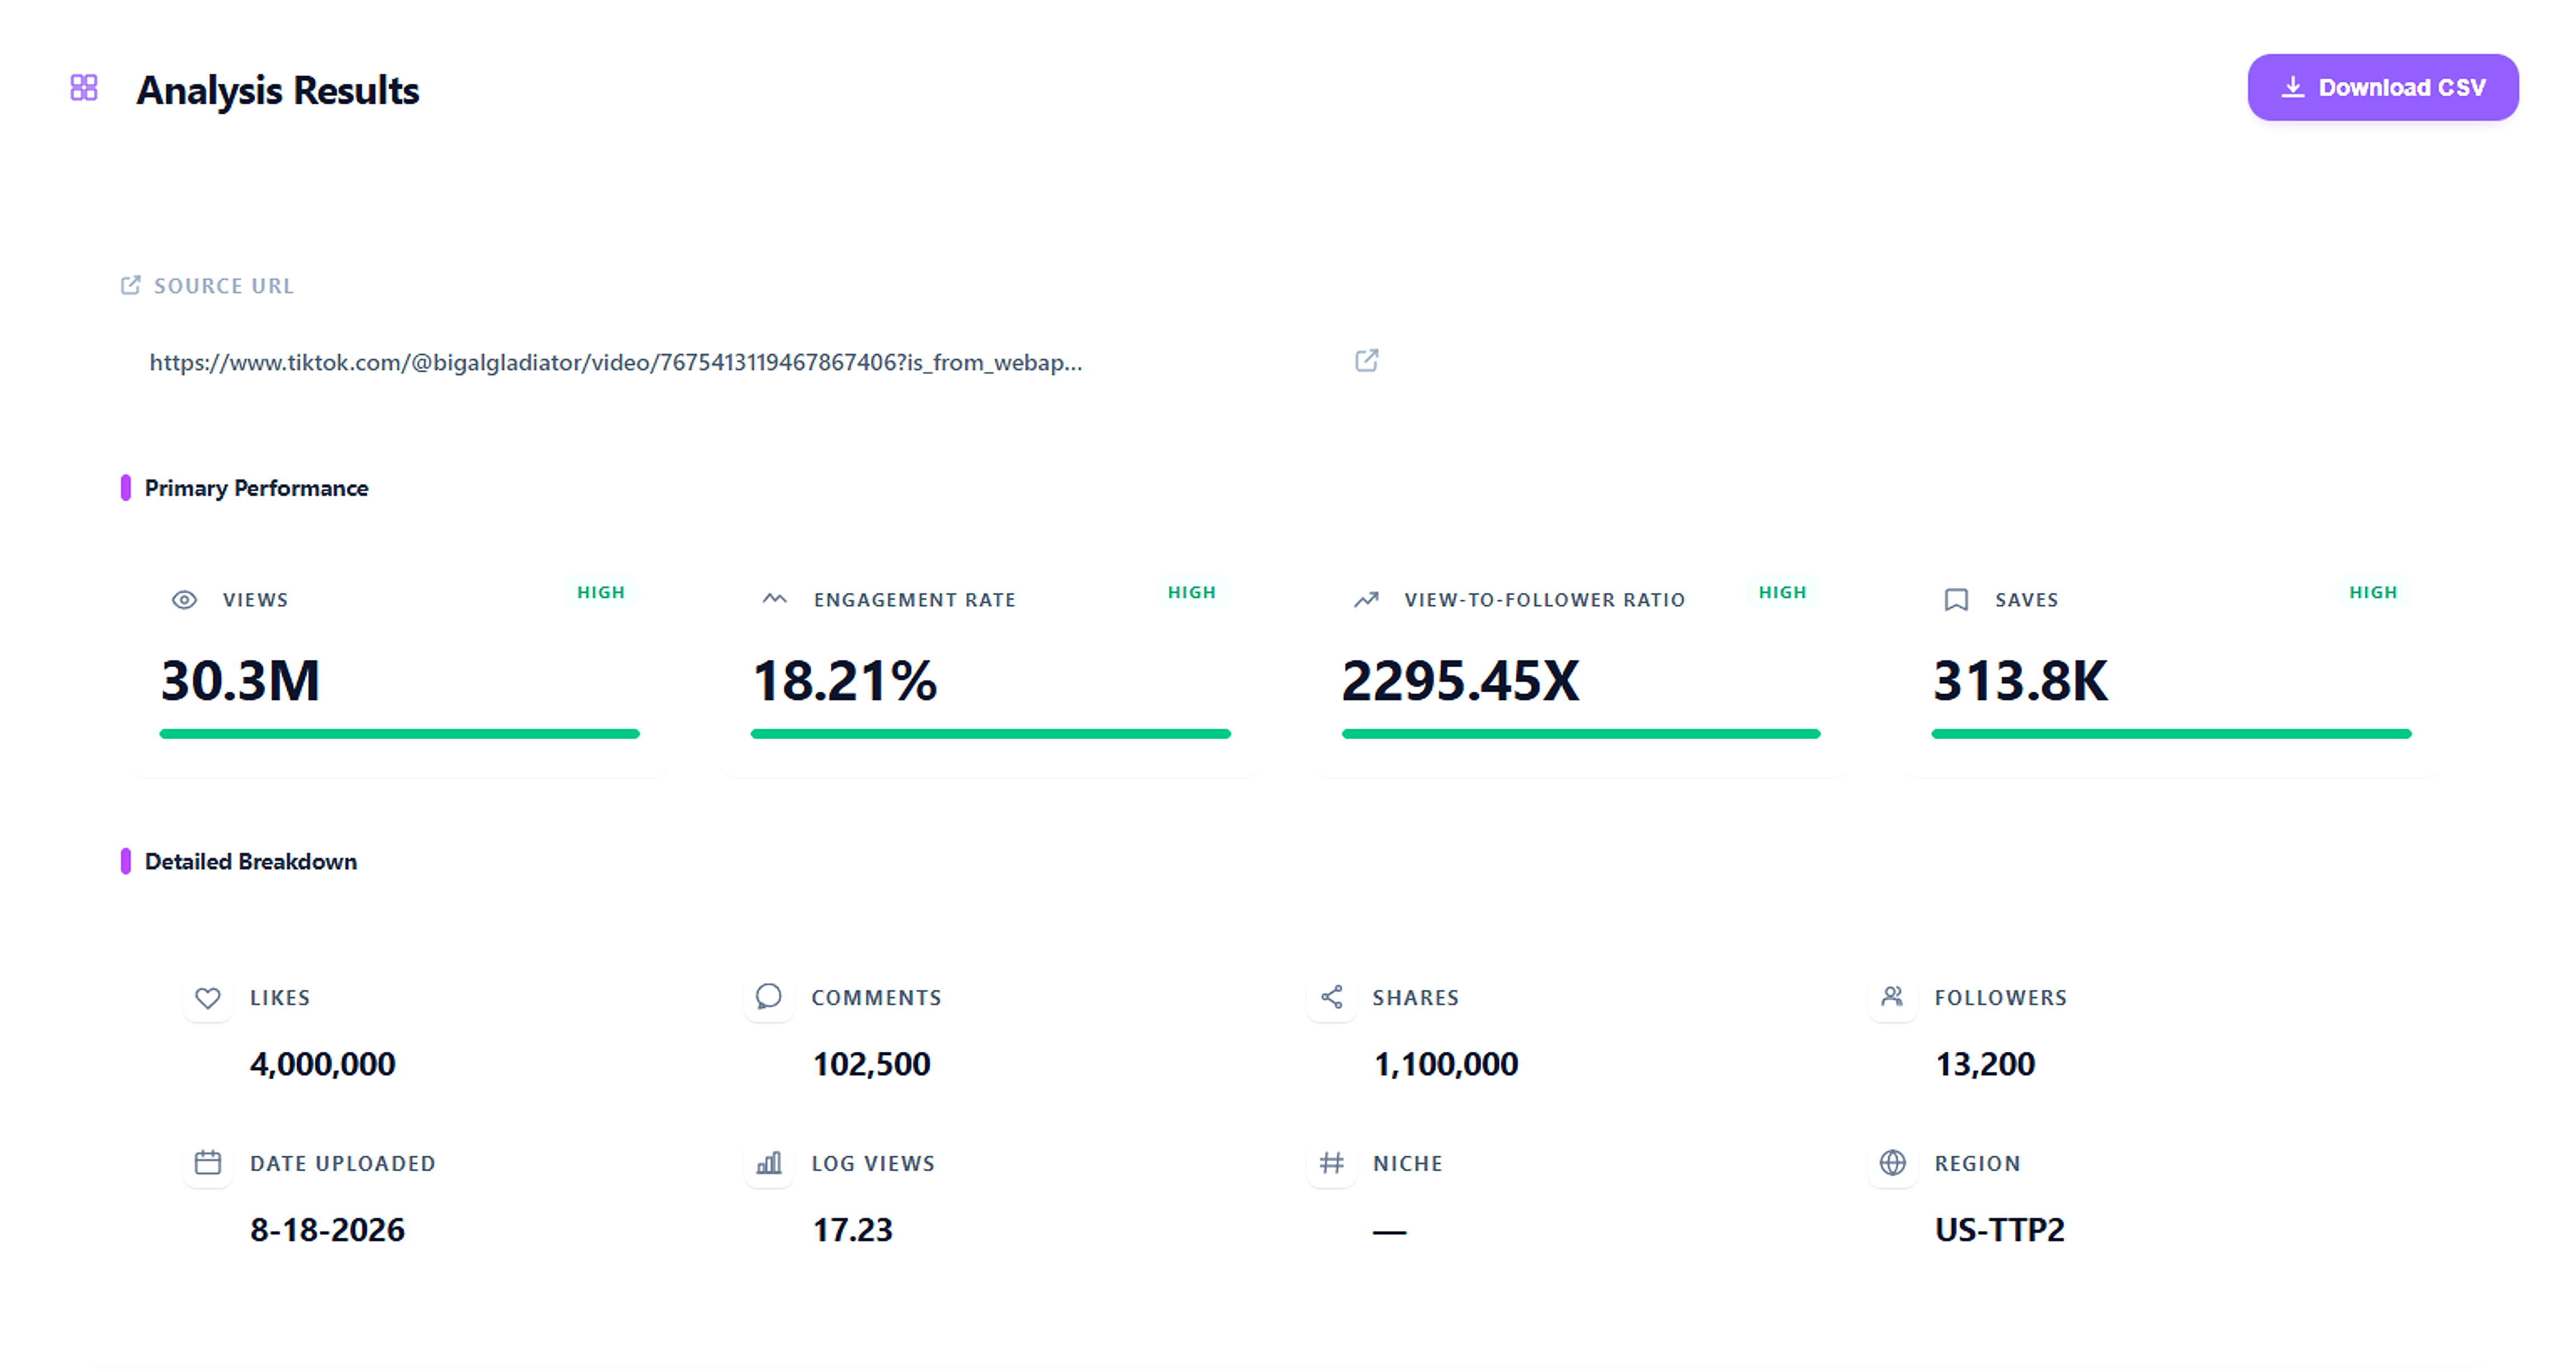
Single Analysis is designed to help creators quickly understand one video before exploring deeper context.
Prioritize the most important signals
Show how the Single experience is structured to help users quickly understand one video's performance before exploring supporting details.
Similar visual weight made the result harder to scan.
Create a clear reading order
Show how the Single experience is structured to help users quickly understand one video's performance before exploring supporting details.
Primary signals first
Surface the metrics users need to judge performance quickly.
Supporting detail second
Reduce visual competition from secondary metrics.
Context when needed
Let users move from the headline result into deeper interpretation.
Compare multiple videos and discover patterns
Bulk Analysis is designed for scanning, comparing, and finding patterns across multiple videos.
Start with the dataset
When creators analyze many videos at once, the overview gives them the overall picture before they inspect individual results.

Support different ways to compare
Ranked and Grouped views help creators examine the same dataset from different perspectives.
Which videos stand out?
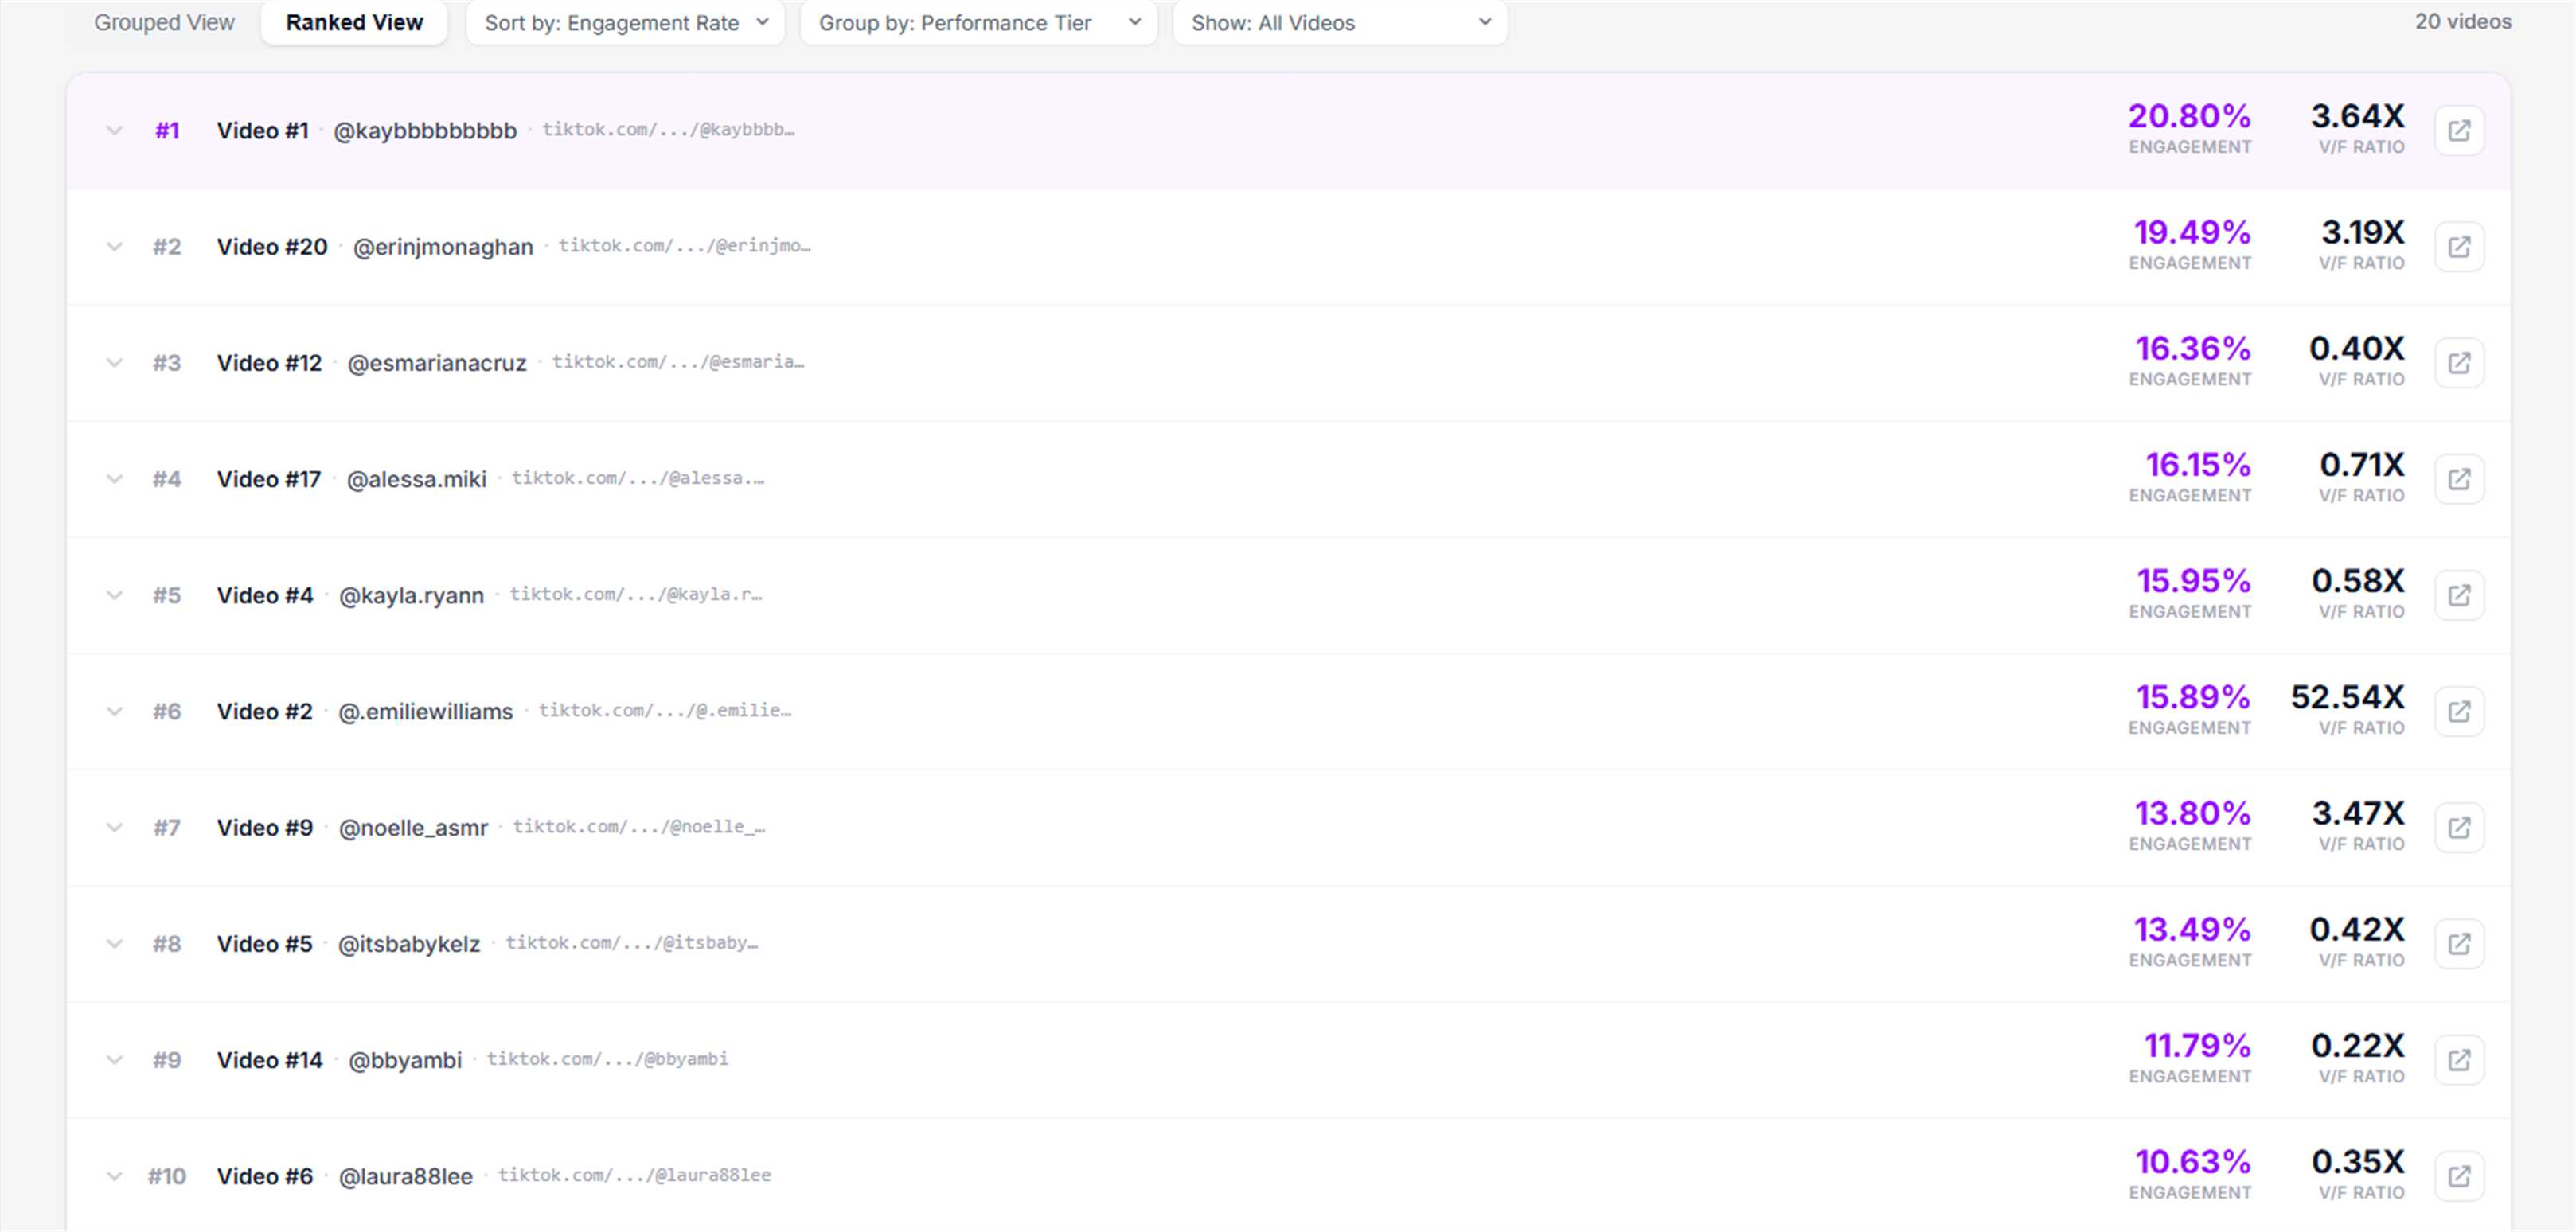
Scan performance in order
Spot stronger and weaker results quickly.
Compare key metrics
Keep important signals visible across rows.
What patterns appear across performance levels?
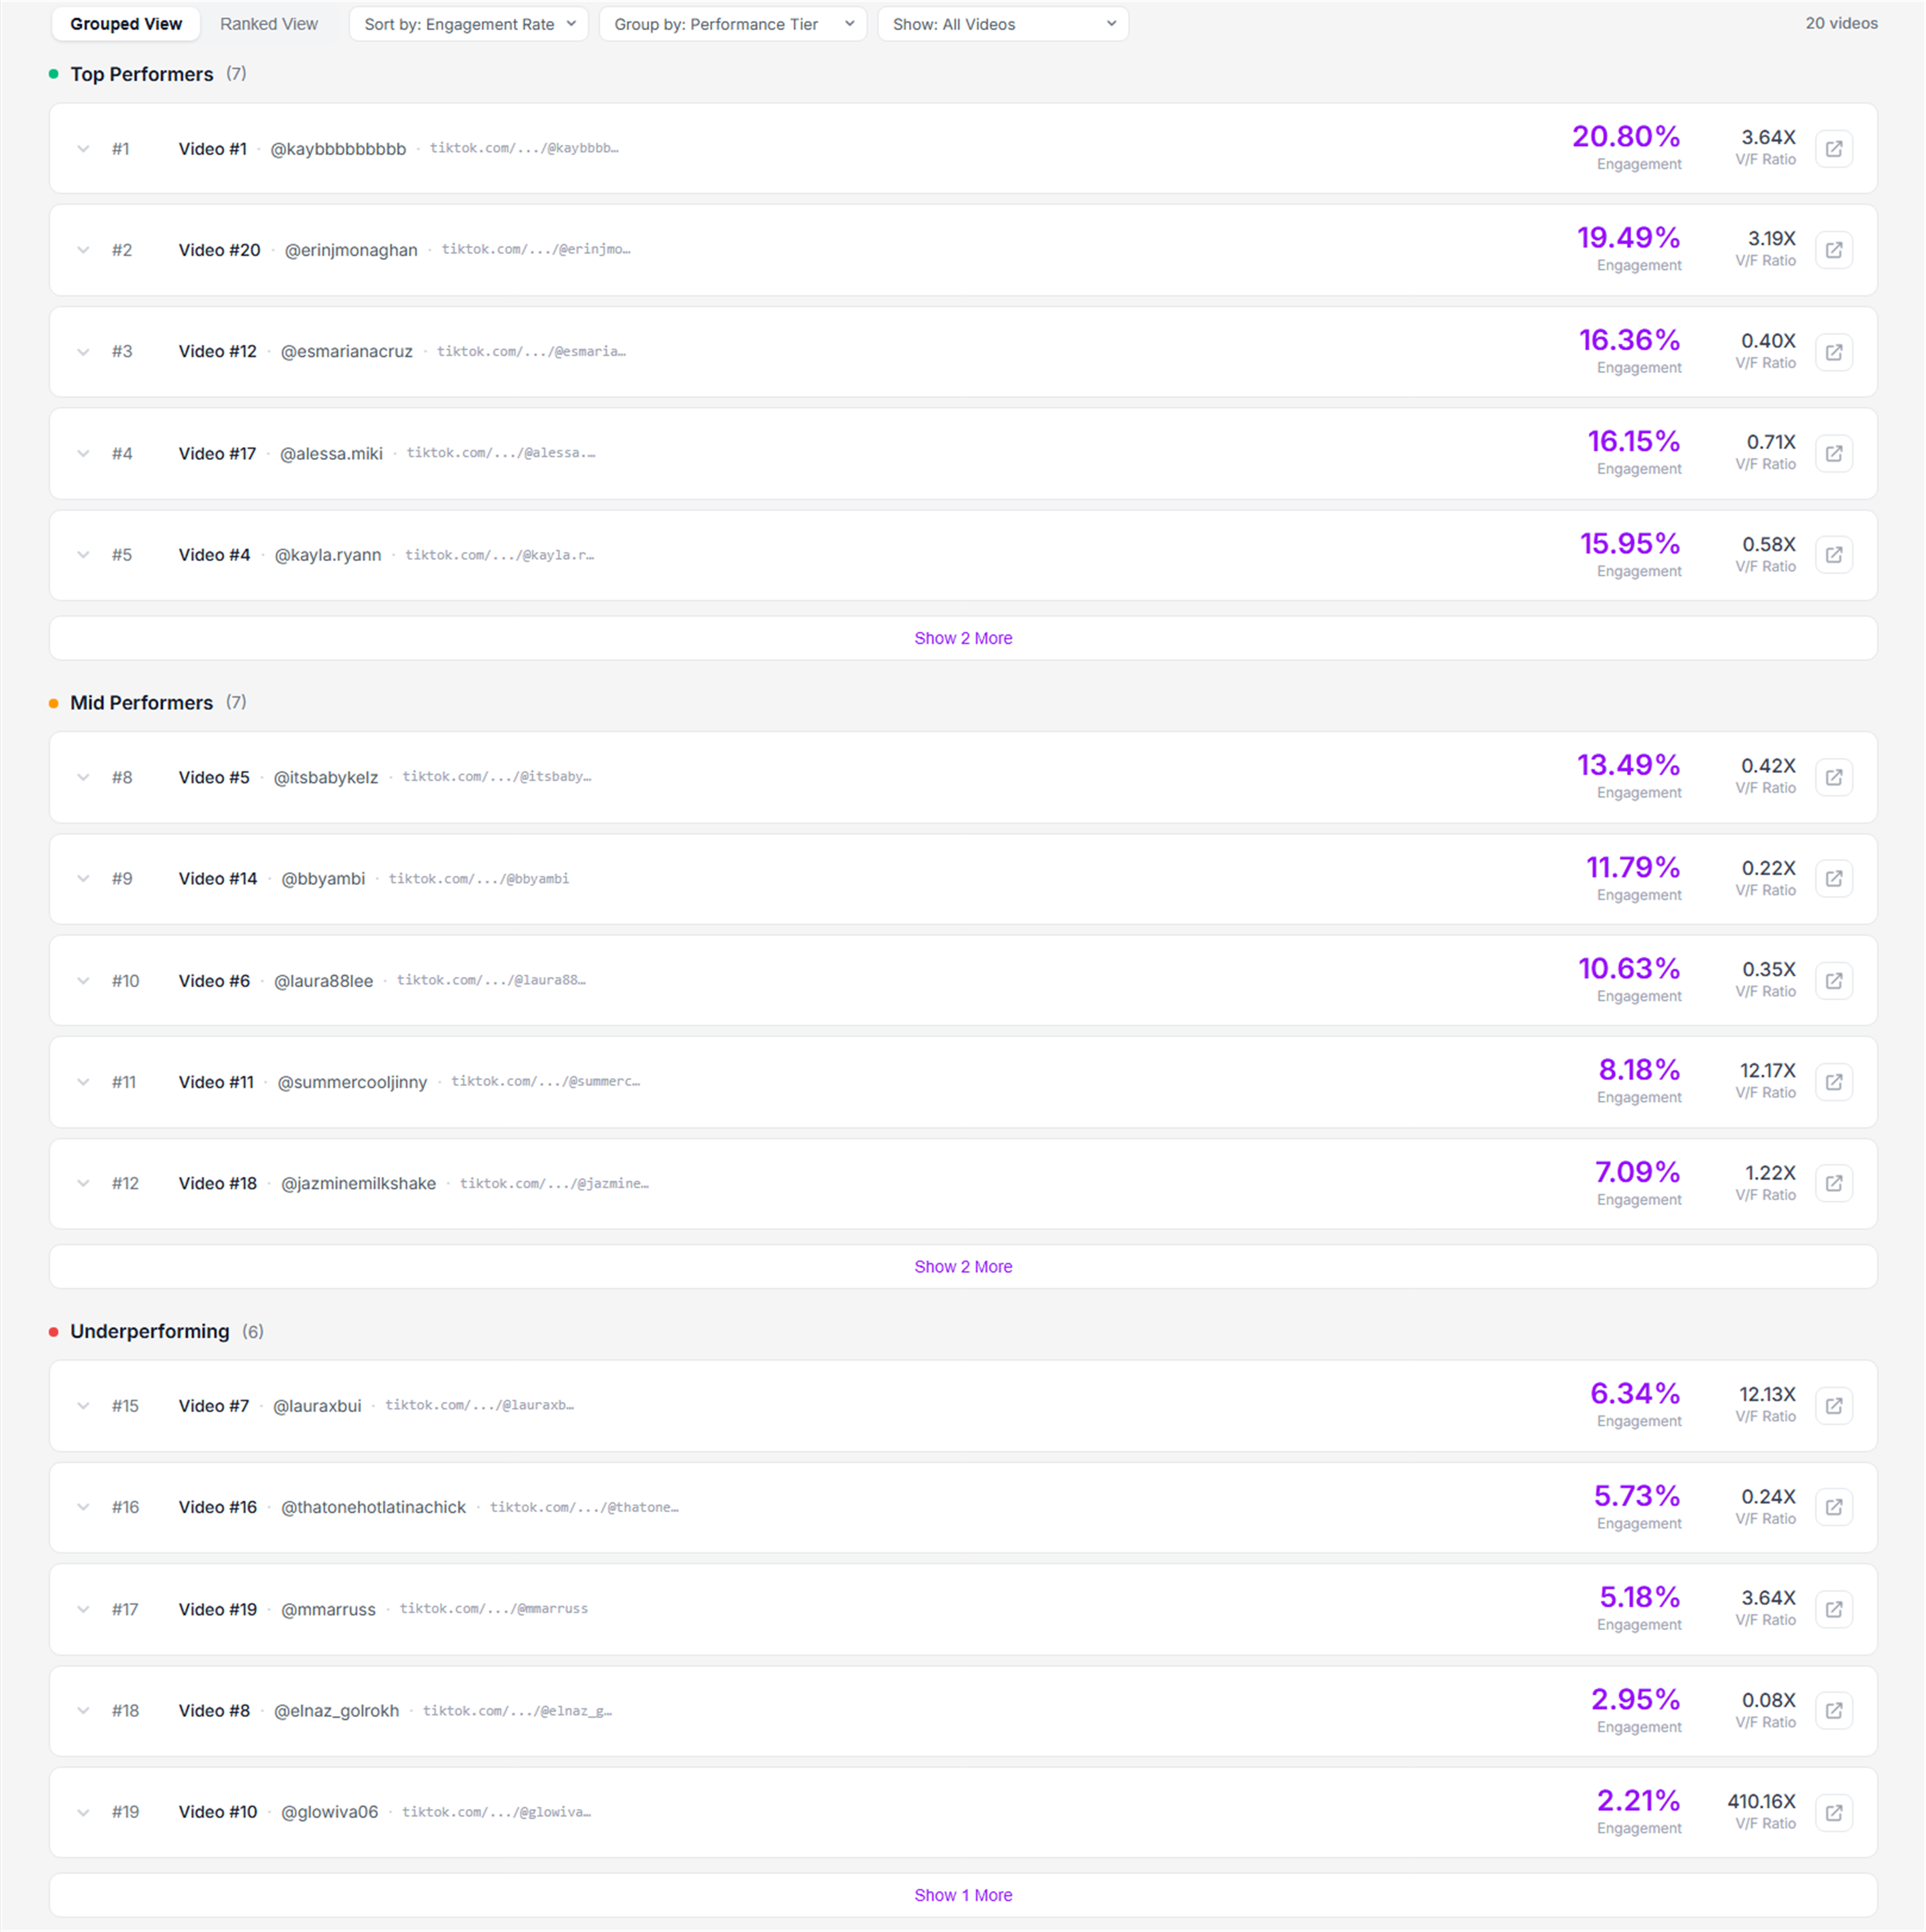
See performance tiers
Separate Top, Mid, and Underperforming content.
Compare within tiers
Look for recurring patterns among similar results.
Explore one result in context
Expanded results add group-level and benchmark context when a creator wants to inspect one video more closely.

Understand one video
Compare videos and discover patterns
Learn from comparable high-performing content
After identifying stronger content in Bulk Analysis, I explored using a relevant high-performing video as a reference for comparison and experimentation.
Start with content worth learning from.
Find a relevant reference.
Make observable differences visible.
Turn the difference into something worth trying.
Compare against a stronger reference
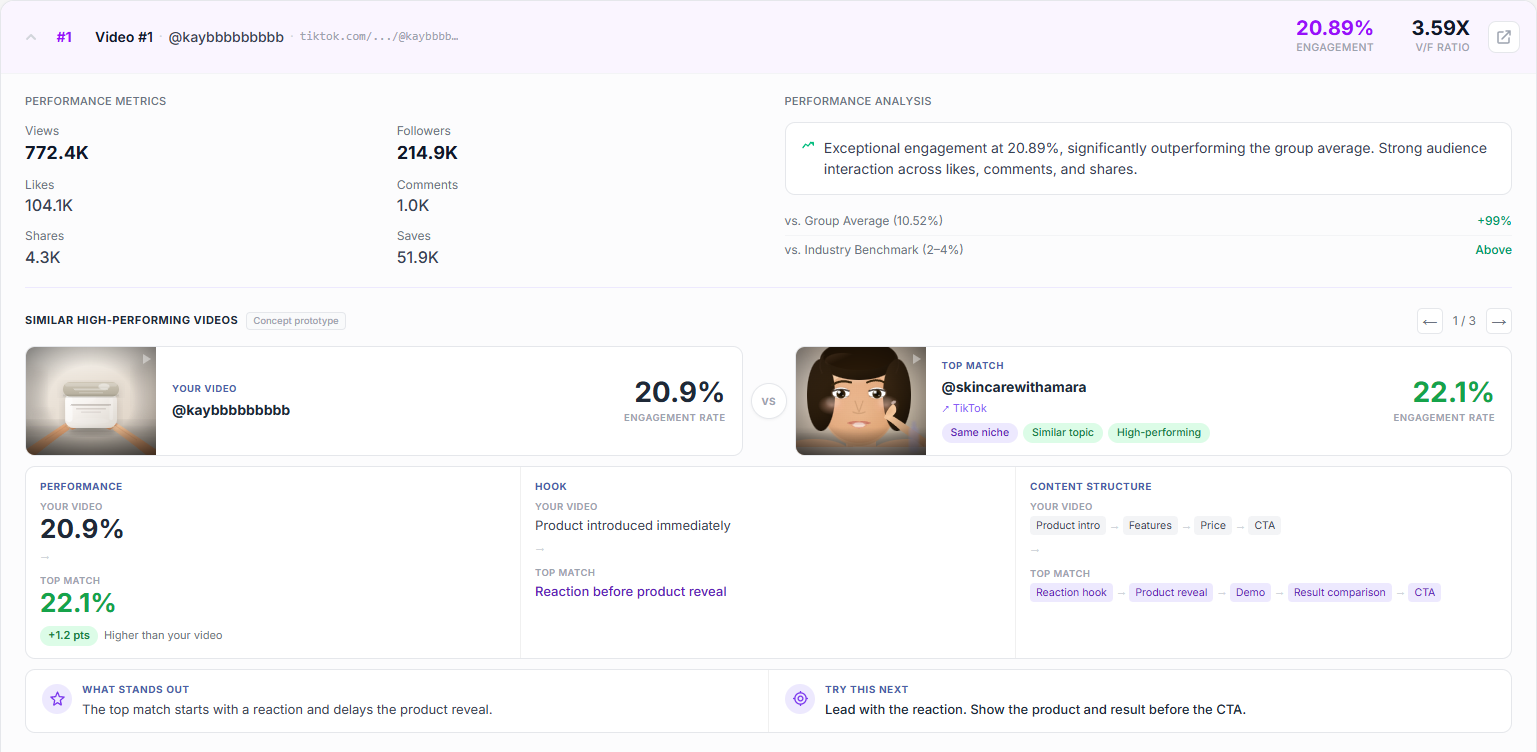
High-performing first
Similarity matters only if the reference is worth learning from.
One strong match at a time
Keep the comparison focused.
From difference to experiment
Suggest something to test, not a guaranteed answer.